The Teesside Photographer
IMD Advance
Photographs developed by statistics. Each image is processed according to the official deprivation ranking of the exact ground it was taken on — the poorest neighbourhoods fade to ghosts, the richest turn golden.
Each frame’s EXIF GPS position is resolved to its Lower-layer Super Output Area and joined to the English Indices of Deprivation. The area’s IMD decile — 1 to 10 — drives every processing parameter. The statistic becomes the developer.
The measure
The Index of Multiple Deprivation is the UK government’s official measure of how deprived every small neighbourhood in England is. Each neighbourhood — around 1,500 people — is ranked against all the others, then the ranking is cut into ten slices called deciles. Decile 1 is the most deprived tenth of England; decile 10 the least.
It decides real things: where funding goes, how areas are described, what a postcode is taken to mean. Much of Teesside sits in decile 1.
This work uses the IoD2025 release: 33,755 LSOAs (2021 boundaries) ranked by a composite of seven weighted domains — Income (22.5%), Employment (22.5%), Education, Skills & Training (13.5%), Health Deprivation & Disability (13.5%), Crime (9.3%), Barriers to Housing & Services (9.3%) and Living Environment (9.3%).
The rank, not the score, is what carries: the IMD is explicitly relative. It says an area is more deprived than another, never by how much, and never that a given person living there is deprived at all.
How the data is made
England is divided into small statistical zones drawn by the Office for National Statistics — not places anyone chose to belong to, just lines that collect roughly 1,500 people each. For every zone, government datasets are gathered: benefit claims, school results, illness, crime, housing, air quality.
These are combined into one number per zone, the zones are ranked, and the rank is simplified into a decile. A neighbourhood’s streets, histories and contradictions arrive at the end of the pipeline as a single digit.
LSOAs are built by aggregating census Output Areas under population and household constraints (~1,000–3,000 residents, ~400–1,200 households), designed for statistical comparability rather than felt geography. Domain scores are constructed from dozens of administrative indicators, ranked, exponentially transformed to prevent one domain’s spread swamping another, then combined with the fixed weights.
The caveats are structural: it measures areas, not people; it is relative, not absolute; it cannot be compared across UK nations or straightforwardly across releases. Every one of those caveats is shed the moment the decile is quoted — which is part of what this series is about.
From photograph to digit
No judgement is made by the photographer at this stage. The image is developed by the state’s opinion of the ground it was standing on.
Mechanically: exiftool reads GPSLatitude/Longitude from EXIF; postcodes.io reverse-geocodes to the LSOA 2021 code; the code joins to the IoD2025 ranks file (File 7 — all ranks, scores and deciles); the decile feeds the processing script. The whole chain is automatic and repeatable — the point is precisely that no aesthetic choice intervenes.
Ghost to golden
The dial: decile 1 renders as a ghost, decile 10 as gold. Every decile between is a straight step along the same line.
A decile-1 image is drained: colour almost gone, contrast flattened to a mist, lifted and softened until the scene barely holds together. A decile-10 image is the opposite: rich, warm, crisp, saturated — the way places look in property brochures. The middle deciles sit exactly where you would expect, partway along the dial.
Two parameter sets define the extremes — ghost (saturation 0.10, contrast 0.48, brightness 1.18, cool shift, Gaussian blur scaled to frame size) and golden (saturation 1.48, contrast 1.12, warm shift, unsharp mask) — and every decile between is a linear interpolation between them. No decile gets an individual look; the treatment is as mechanical as the measure.
One frame, three verdicts
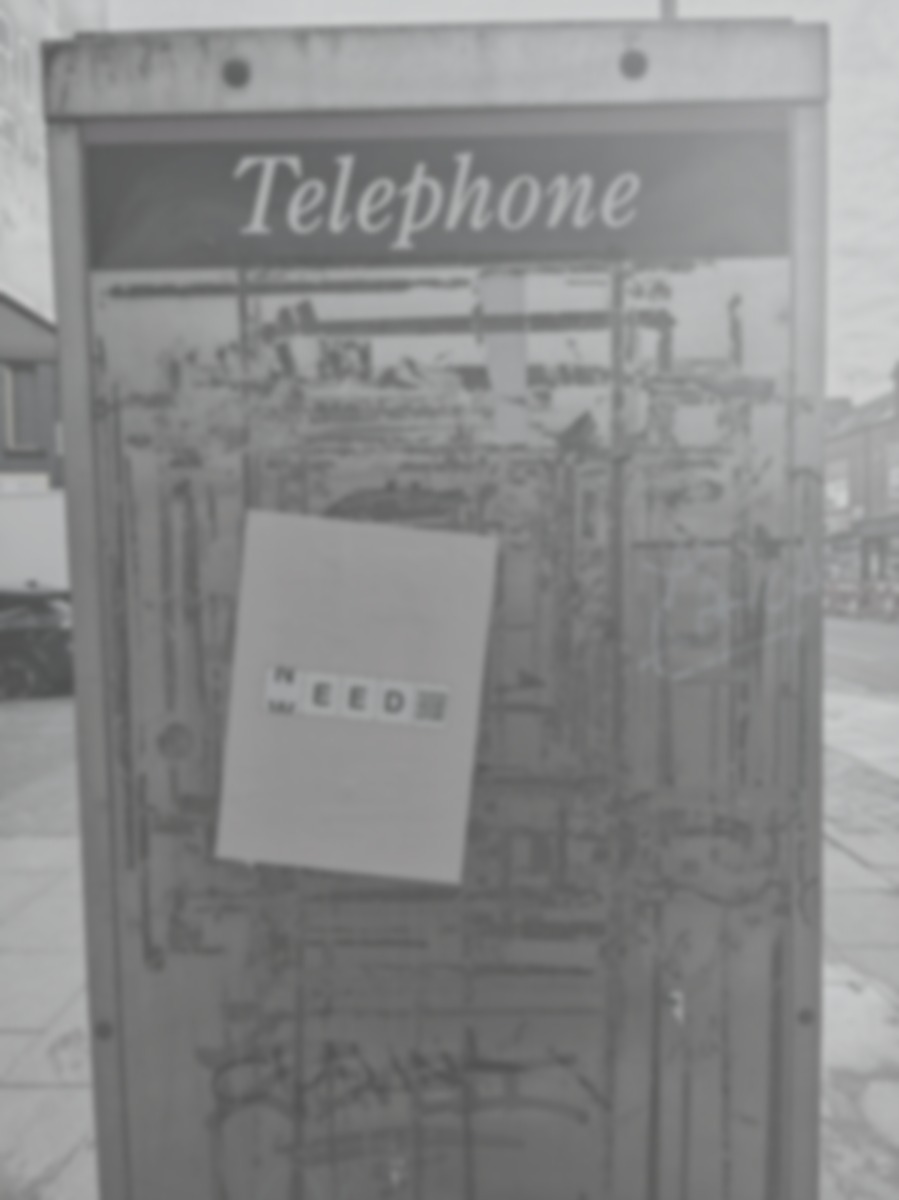
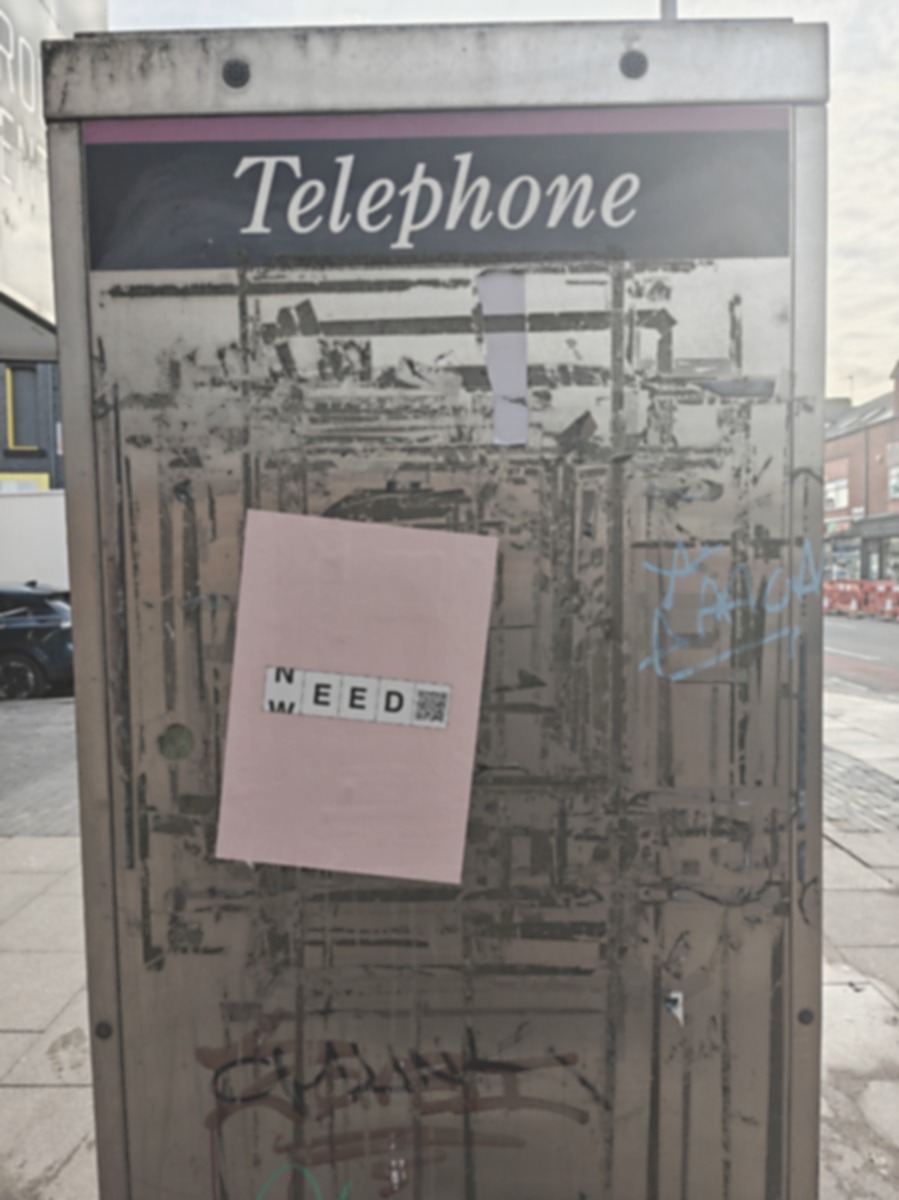
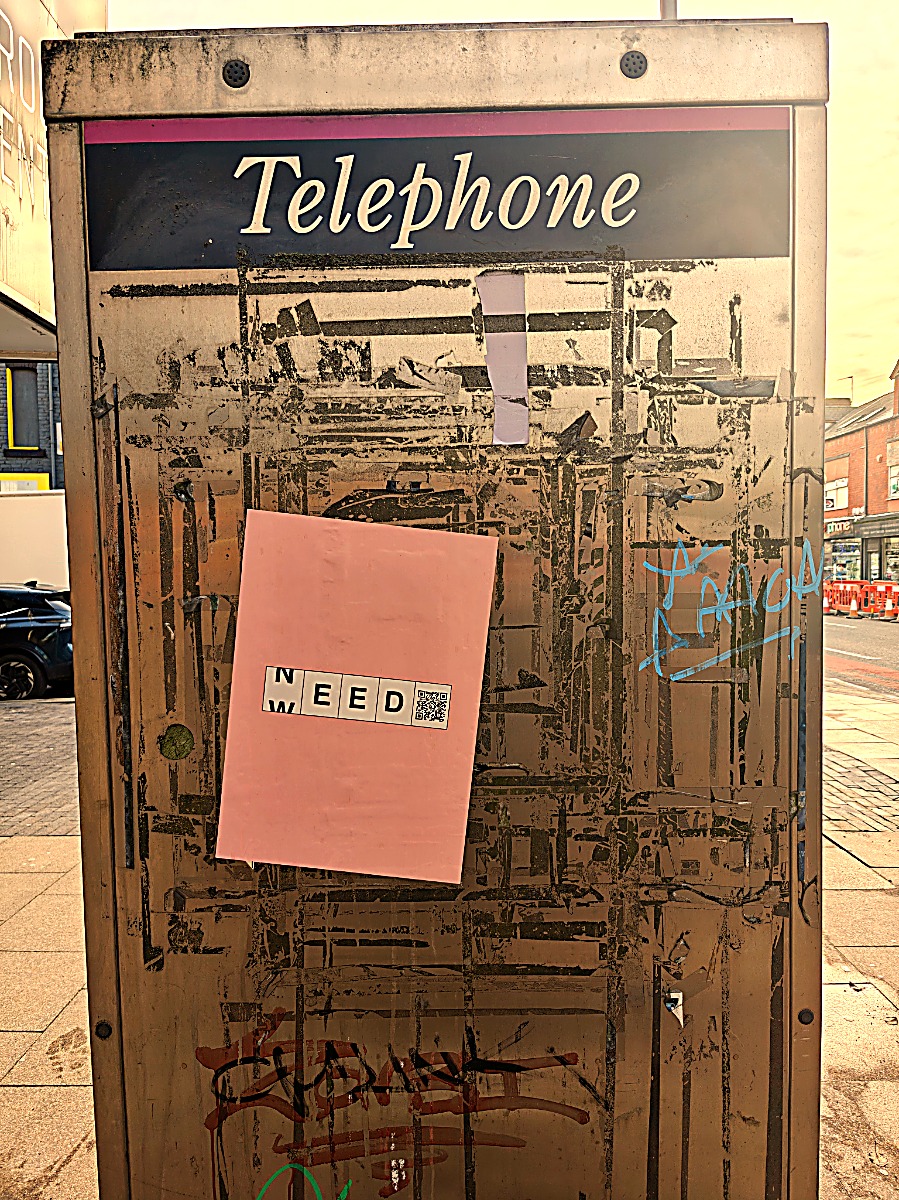
The same photograph — a phone box in TS1, central Middlesbrough — developed at three deciles.
Nothing about the place has changed between these frames. Only the digit has.
TS1’s actual LSOA sits in decile 1: the left frame is the “true” development. The other two are cross-processed — the image developed under a statistic that belongs to somewhere else.
Why process a photograph this way?
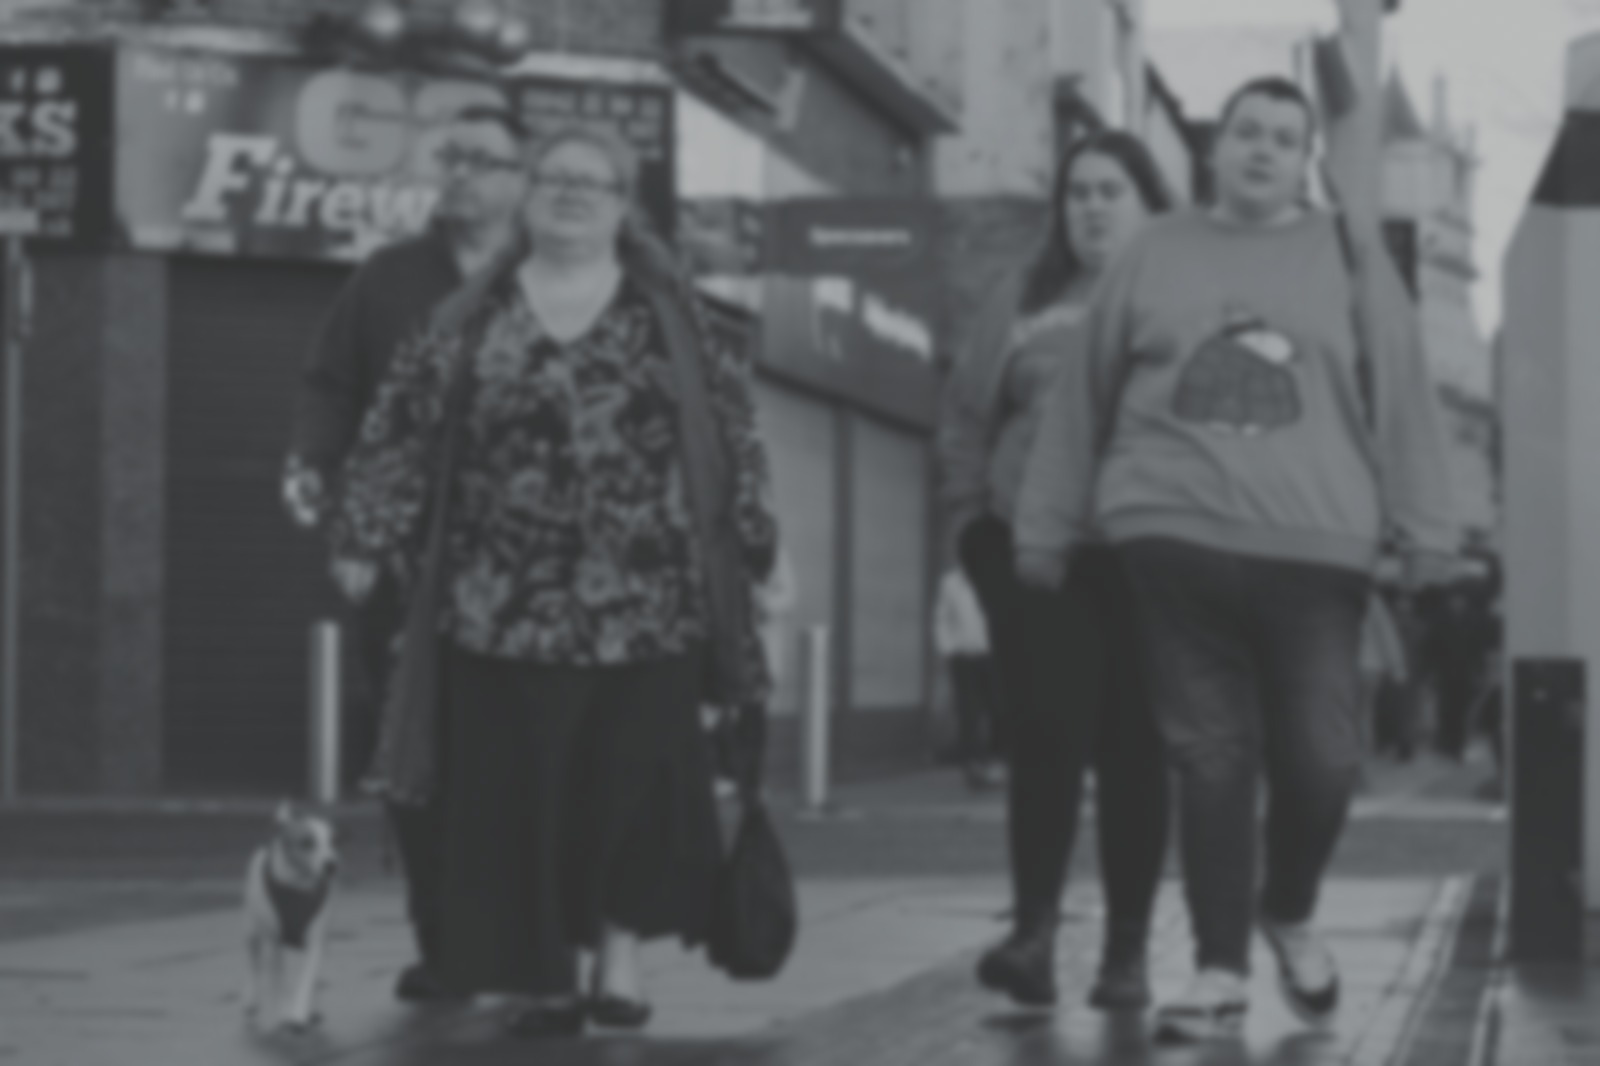
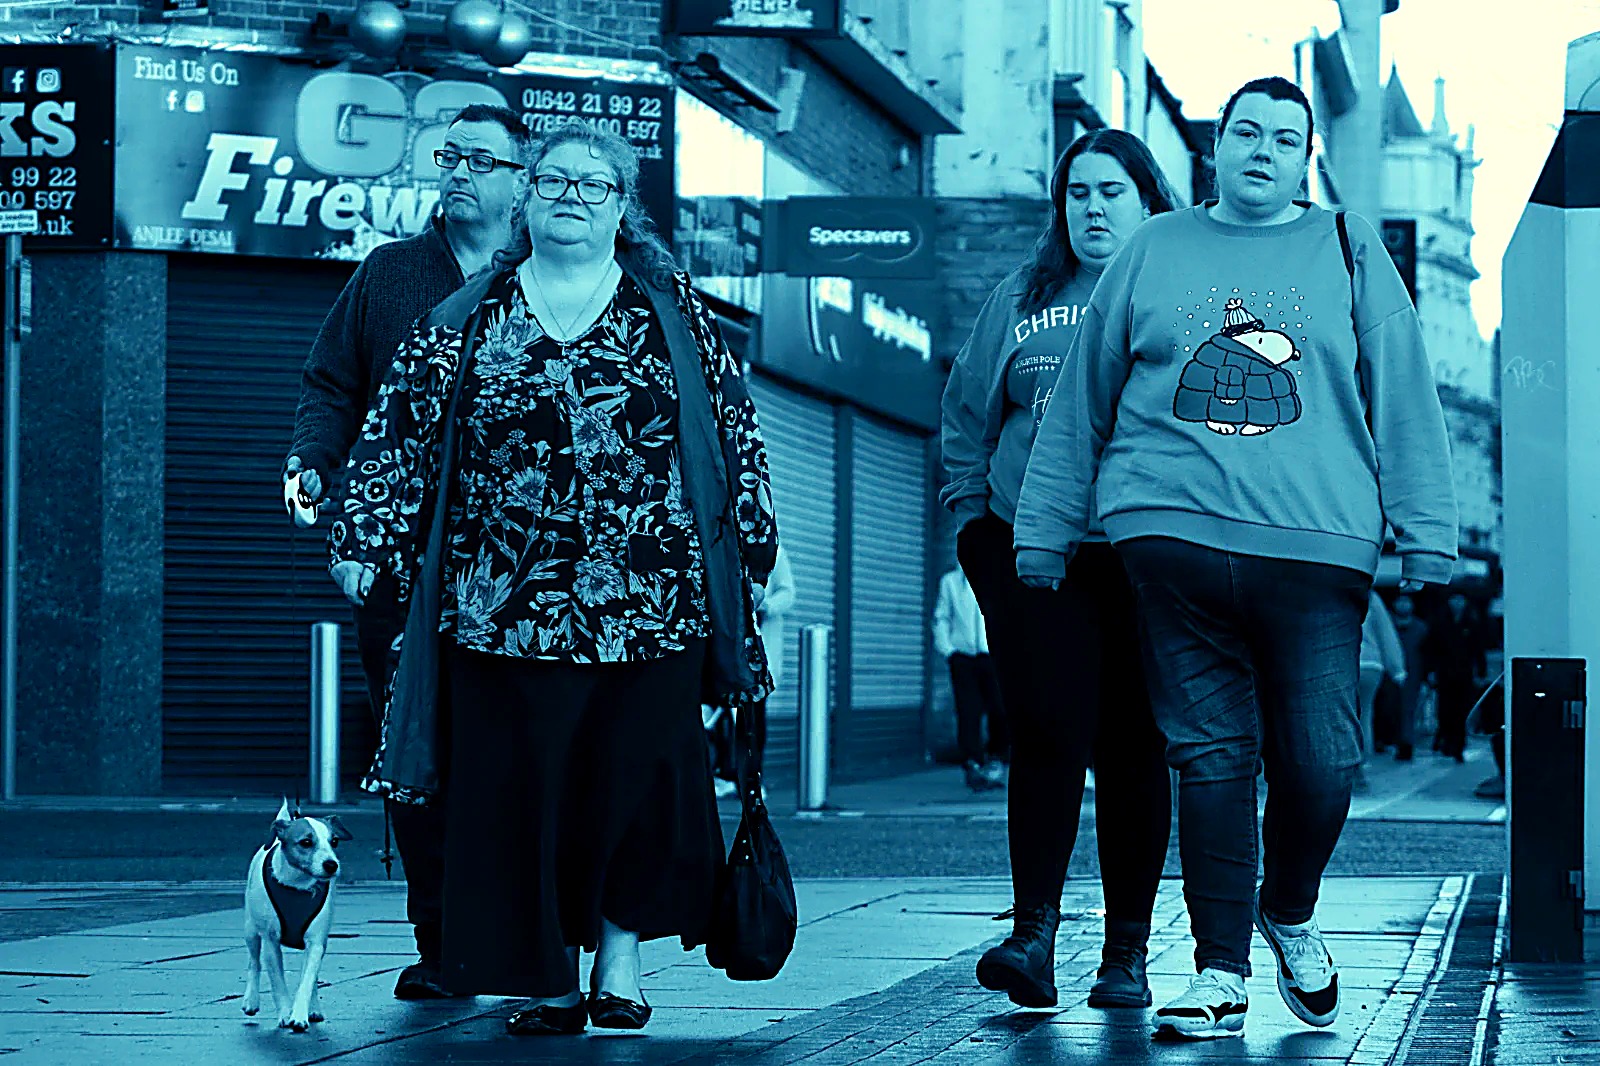
Because the digit does this anyway — just invisibly. A neighbourhood ranked “decile 1” is seen through that ranking: by planners, by journalists, by anyone told the number before they visit. The processing only makes the filter visible.
And swapping the digits is the argument in one move. Develop a decile-1 street as a decile 10 and it glows; develop gold as a ghost and it fades. The place never changed. If a single swapped digit can do that to a photograph, consider what it does to a town.
The IMD is honest about being reductive — relative, area-level, seven domains flattened to one rank — but it is consumed as if it were a verdict, and the verdict has material force: funding formulas, insurance, mortgage risk, news framing, the word “deprived” arriving ahead of any person. The series literalises that consumption: the statistic is piped directly into the emulsion, aesthetic choice removed, so the viewer watches classification do what classification does.
Cross-processing is the critical gesture. It severs the digit from the ground while keeping the machinery running, and the machinery doesn’t notice — it renders a decile-1 family golden as happily as it ghosts them. The indifference is the point: the measure was never looking at them.
Notes
All photographs made on Teesside and the North East. The deprivation data is the government’s own, unaltered; the processing is automatic from the digit. No image is retouched by hand.
Pipeline: Fujifilm X-T5 with GPS location → exiftool → postcodes.io → IoD2025 File 7 → Python/Pillow processing script (two calibration extremes, linear interpolation across deciles). Outputs are reproducible: the same frame and digit always develop identically. Data: English Indices of Deprivation, MHCLG; LSOA 2021 boundaries, ONS.